
In technical analysis, indicators are used in two main ways:
- To confirm price movement and the quality of chart patterns
- To create buy signals and sell signals
Indicators can be a great source of additional information that strengthens or weakens the story told by other available data. You can use indicators to help spot and analyse trends, momentum, volatility, and more.
Leading indicators and lagging indicators
The two main types of indicators areleading andlagging. Both have their origin in calculations that involve things such as price, price movements, volume, money flow, trends, volatility and momentum.
Aleading indicator precedes price movements and is used in an effort to predict future movements. Leading indicators tend to be extra strong during periods of sideways or non-trending trading ranges.
Alagging indicator follows price movements and is used as a confirmation tool. It can be useful in both trending and non-trending periods.
Indicator constructions
There are two main types of indicators constructions:
- Oscillators
- Non-bounded indicators
Oscillators are bound within a range. In technical analysis, oscillator indicators much more commonly used than non-bounded indicators. Oscillator indicators always have a range, e.g. 0 – 100. They can warn you about periods where the security is overbought (close to the top of the range) or oversold (close to the bottom of the range).
Non-bounded indicators are chiefly used to display strength or weakness, and can be the basis of buy signal and sell signal generation.
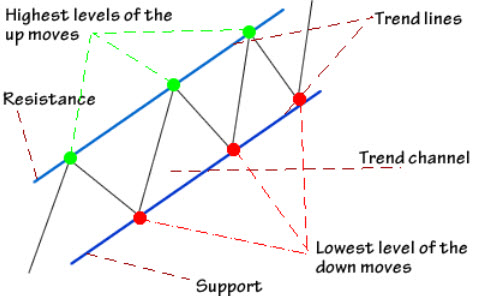
Crossovers
A crossover occurs when the price moves through the moving average, or when two different moving averages cross over each other. Crossovers are frequently used to create buy signals and sell signals for technical analysis trading, but they should ideally not be used on their own – it is safer to double check with additional data to get a more comprehensive understanding of the situation.
Divergence
When the direction of the price trend and the direction of the indicator trend are moving in two opposite directions, it is called divergence. This is typically interpreted as a sign of the price trend becoming weaker.
Moving Average Convergence Divergence (MACD)
The moving average convergence divergence (MACD) is a well-known indicator in the field of technical analysis. It measures momentum for a security.
The MACD is the difference between two exponential moving averages, plotted against a centerline. Typically, the exponential moving average of the MACD itself will also be plotted on the chart.
You calculate the MACD by subtracting the longer-term moving average from the shorter-term moving average. The idea is that comparing the two moving averages can help us see the current direction of momentum.
You can select the shorter-term period length and longer-term period length that suits your needs when calculating the MACD. Using 12-day moving averages and 26-day moving averages is very popular among technical analysts, with the signal line being based on the 9-day exponential moving average of the MACD values. Looking at highly volatile securities? You are probably better off using shorter periods than this. Looking at securities with very low historical volatility? You might need to use extra long periods to obtain useful information.
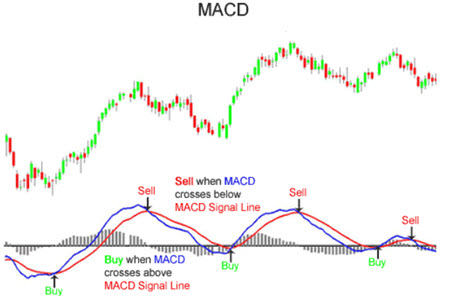
Positive MACD
A positive MACD signals that the short-term moving average is above the longer-term moving average. This suggests upward momentum.
Negative MACD
A negative MACD signals that the short-term moving average is below the longer-term moving average. This suggests downward momentum.
Crossover
The centerline is the point at which the two moving averages are equal. When the MACD line crosses the centerline, it signals a crossing in the moving averages.
MACD histogram
The MACD histogram is plotted on the centerline and represented by bars. Each individual bar represents the difference between the MACD and the signal line or the 9-day exponential moving average.
The higher the bar (upwards or downwards), the larger the momentum behind the direction.
Accumulation / Distribution Line
This is a non-bounded volume indicator that measures money flows in a security. The basic idea is to measure the ratio of buying to selling, and this is done by comparing the price movement of a period to the volume of that period.
With the acumuluation / distribution line we are simply keeping in a running sum over the period for a security. If the acummulation / distribution line is trending upward, it is a sign of a bullish market for the security.
This is what the formula looks like:
Acc/Dist = ((Close – Low) – (High – Close)) / (High – Low) * Period\’s Volume
In many software programs for technical analysis, you can calculate the accumulation / distribution line for a security without having to know all the details of the formula.
Average Directional Index (ADX)
This trend indicator is not used to identify the direction of the prevailing trend. Instead, it is typically utilized to measure the strength of the trend and identify the momentum behind the trend.
The Average Directional Index (ADX) is a combination of two other price movement measures, which are plotted along with the ADX line.
- The positive directional indicator (+DI). This measures the strength of the upward trend.
- The negative directional indicator (-DI). This measures the strength of the downward trend.
The scale used is normally 0-100. Readings above 40 is seen as a sign of the trend being strong. Readings below 20 is seen as a sign of the trend being weak.
The Aroon Indicator
Compared to many indicators used in technical analysis, the Aroon indicator is a young one. Popularized in the 1990s, the versatile Aroon indicator is a trending indicator used to measure both trend direction and trend magnitude. It is also utilized as a tool for predicting when a new trend is starting.
The Aroon indicator consists of two lines:
- The Aroon Up Line. Measures how long it’s been since the highest price occurred in the chosen time period. This line is usually coloured blue in technical analysis software.
- The Aroon Down Line. Measures how long it’s been since the lowest price occurred in the chosen time period. This line is usually a red dotted line in technical analysis software.
The Aroon Oscillator
This is an expansion of the Aroon indicator. The Aroon oscillator plots the difference between the Aroon up line and the Aroon downline. The result is plotted within a -100 to +100 range. The centerline is thus 0.
The closer the value is to +100, the larger the upward pressure in the security.
The closer the value is to +100, the larger the downward pressure in the security.
When the oscillator passes through 0 (the centerline), it is regarded as signal of a trend reversal.
Example: The Aroon oscillator has been positive for a while, but is now passing through zero and going into negative territory. The technical analyst will interpret this as confirmation of a downward trend.
Trend reversals can also be predicted using divergence. If the oscillator and the price trend are moving in opposite directions, it is considered a sign of trend reversal.
Relative Strength Index (RSI)
The relative strength index (RSI) can help us notice overbought and oversold conditions for a security. This indicator is plotted in the 0 – 100 range. A reading below 30 is interpreted as a signal of oversold conditions. A reading above 70 is interpreted as a signal of overbought conditions. An overbought or an oversold situation can increase the risk of an imminent reversal.
You can use the number of trading days that is best for your needs when calculating an RSI. Among technical analysts, using 14 trading days is very popular. Using fewer days than this will create a more volatile RSI, suitable for shorter-term trading.
On-Balance Volume (OBV)
The on-balance volume (OBV) indicator reflects movements in volume.
Calculating the OBV:
- Take the total volume for the trading period and assigning it a positive or negative value, depending on if the price is up or down during the trading period. Price up = assign positive value. Price down = assign negative value.
- Add the positive or negative volume total for the period to a total that is accumulated from the start of the measure.
The actual exact value of the OBV is actually not that important – it is much more important to look at the trend in the OBV.
Stochastic Oscillator
This is a momentum indicator.
The basic assumption made by technical analysts using this indicator is that in an uptrend, the price will close near the high point of the trading range. A close price that is near the high point is therefore interpreted as an upward momentum signal.
There is also the assumption that if the price closes near the low point of the trading range, that’s a signal of downward momentum.
The stochastic oscillator is plotted within the 0-100 range. If the value is over 80, it is considered a signal of overbought conditions. If the value is below 20, it is considered a signal of oversold conditions.
The stochastic oscillator contains two lines:
- The %K line
- The %D line
The %K is the raw measure used to formulate the idea of momentum behind the oscillator. The %D is a moving average of the %K. Traders will typically focus on the %D line when making trading decisions.
You can use any number of trading periods when you carry out your calculations. It is very common among technical analysts to use 14 trading periods for the stochastic oscillator.