
The market can be described as an ongoing struggle between sellers that want to get paid as much as possible and buyer that want to pay as little as possible. Potential sellers constitute the supply, while potential buyers make up the demand. A major assumption in technical analysis is that these two market factors continuously create support levels and resistance levels for the price of the thing that is being traded.
Example:
The price of share XYZ is swinging up and down on your chart. You notice that for the period you are looking at, the price never falls below $30. As soon as the price gets close to $30, it is as if buyers that were previously uninterested in buying the share now flock to get it at this price. Or maybe the sellers are simply not offering any shares for less than $30? You can’t know exactly which mechanisms that are at play, but you can see the result and the result is a support level at $30.
You also notice that the peaks on your chart never rise above $40. As soon as the price reaches $40, a lot of potential buyers seem to take a step back and refuse to make a purchase, decreasing the demand for shares in XYZ. Or maybe at lot of sellers have placed automatic orders in the system, telling the software to sell their shares in XYZ as soon as there is someone out there willing to pay at least $40 each for them? That would increase the supply and make it possible for buyers to purchase the shares they want without having to pay more than $40 per share. What ever is going on, you see that a resistance level has formed at $40.
Breaking through support and resistance
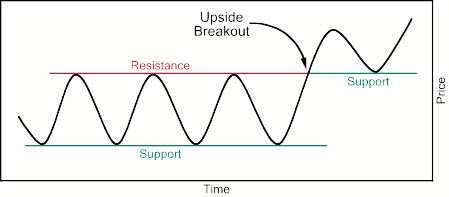
A general assumption in technical analysis is that it is difficult for the price to break through formed levels of support and resistance. We often see prolonged periods of trading where the price bounces up and down within the channel created by the support line (lower line) and the resistance line (upper line). The cause behind this behaviour is believed to be human psychology.
Of course, eventually we are likely to see a break – the price actually starts to plummet below the support level or soar above the resistance level. Being able to predict these breaks is in integral part of being a skilful technical analyst. Also, a skilled analyst will be able to quickly detect when a new support level and a new resistance level have been established.
Human psychology and round numbers
 In the example above, we had a $30 support level and a $40 resistance level. Both are nice and round numbers, and we didn’t select them just to make it easy for ourselves in the example. The truth is, that when we look at actual historical price charts, we often see support and resistance form around round numbers, e.g. $10, $20, $30, $50, $75, $100, and so on.
That also means that we can see a $10 support level on a market where the share is traded in USD, but it wont correspond to a €9.27 support level on the market where the same share is traded in EUR. Instead, the support level on the euro-market is nice and round too: €10.
This has to do with human psychology. Many human traders will not decide that $97.31 is exactly what this share is worth to them and enter a buy order at $97.31. Instead, they go for something rounder, such as $95 or $100. The same goes for the sellers – they are willing to let go if their shares for a minimum of 50 bucks a pop. Not $50.57 or $49.84.
Of course, there will always be traders that exploit this fact buy not using round numbers for their buy and sell orders. However, even they can be consciously or subconsciously impacted by support and resistance levels. “Look, the price of that share is falling, if this continues it will dip below $100 soon. A hundred bucks is a bargain for shares in that company, maybe I should enter a purchase order at $101” or “Oh wow, people are really hungry for shares in XYZ right now after those good news were released. The price will hit $150 soon. $150 is a really good price, maybe I should sell off my shares in XYZ and realize a nice profit while I have a chance.”
Reversal
Once the price breaks through the support level and a new lower support level is established, the previous support level will often (but not always) become the new resistance level.
Example: The resistance is $50 and the the support is $40. The price breaks through the support and $35 is established as the new support level. $40 becomes the new resistance level. This is known as reversal.
There are several reason why this is such a common occurrence. One of them is that once the price fell below $40, a lot of traders noticed and rushed in to buy, feeling like they were getting the share for a bargain price now when it was finally possible to buy it for less than $40. These traders will not be interested in buying at above $40, which is why $40 becomes the new resistance.
Of course, the same is true when the price is going up. The resistance level is $50 and the support is $40. The price breaks through the resistance level and $60 is established as the new resistance level. $50 becomes the new support level. A reversal has taken place.
N.B! A break beyond a level of resistance or beyond a level of support doesn’t have to be a reversal. The price can for instance move above the resistance level within an upward trending channel without that being a reversal. In this case, the price is moving within the trend.
For a true and lasting reversal to the place, the price needs to make a strong move through support or resistance, not just follow a predictable pattern within a sloping channel.
Trading
Technical analysts are known to make trading decisions based on their analysis of support levels, resistance levels and the likelihood of an imminent break through.
Example: You notice a $40 support level and a $50 resistance level for B-shares in company XYZ. You own 300 B-shares in company XYZ. Now, you see patterns forming on the charts that you interpret as a sign of the price being about to break the $40 support level and establish a new and lower one. The patterns indicate that the market has been testing the $40 barrier several times and nearly being able to break through. You decide to put all your shares on the market for $47 right now, hoping to sell them before the reversals takes place.
Generally speaking, novice technical analysts should avoid placing orders exactly at the support level or exactly at the resistance level. Be aware that it is common for the price to never perfectly reach that beautiful round number. The price areas right around the support level and around the resistance level tend to be marked by very high volatility, with prices darting around the magical number by never actually getting right on it.