 If you’re interested in stock trading, you are probably already at least somewhat familiar with fundamental analysis. Fundamental analysis is one of two main approaches to stock trading analysis; the other one being technical analysis.
Fundamental analysis is based on the idea that in order to predict future marker movements, we need to look at the so called fundamentals. For stocks, this could be things such as the company balance sheet and quarterly reports.
Technical analysis on the other hand is based on the idea that the market itself is the best predictor of future market movements. If we want to be able to predict future movements, we need to look at historical market data and analyze it to find patterns.
Of course, it is possible for traders to allow both fundamental analysis and technical analysis impact their trading decisions. Fundamental analysis will typically take a comparatively long-term approach to investing compared to technical analysis which is often utilized for daytrading and similar. One of the reasons for this is that it can take quite a lot of time before a company’s intrinsic value is properly reflected in the market value of its shares.
Fundamental analysis

Fundamental analysis is a great way to spot long term value in a stock but can provide limit information about short term performance. Financial statements is an essential part of fundamental analysis. You can for instance start by looking at a stock company’s balance sheet, income statement and cash flow statement. (Advanced fundamental analysis will of course take considerably more information into account.)
A basic assumption with fundamental analysis is that there is such as thing as intrinsic company value and that this value can be measured and determined by analysing financial statements and similar data. When the analyst notices that a share is trading below its intrinsic value, it will peak his/her interest in buying it. Similarly, a selling decision can be triggered by noticing that a share is trading above its intrinsic value.
Technical analysis
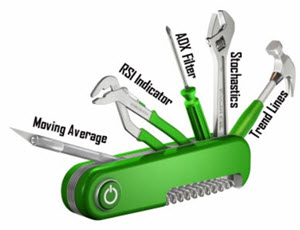
Technical analysis is a way to analyse the market movement to spot trends and other indicators that gives you an idea of where the market might be moving in the short term. TA is less reliable the further into the future you try to analyse the market. This makes Technical analysis a perfect tool for day traders, Binary options traders and CFD traders. Learn more about how you can use technical analysis to make money trading with binary options and cfd certificates.
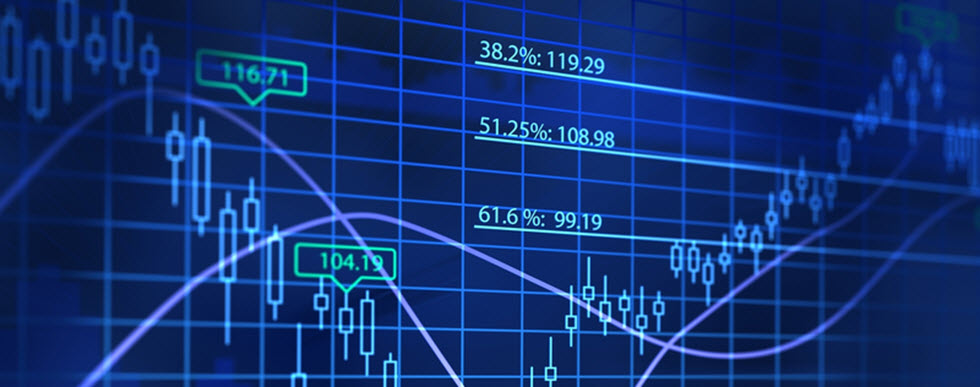
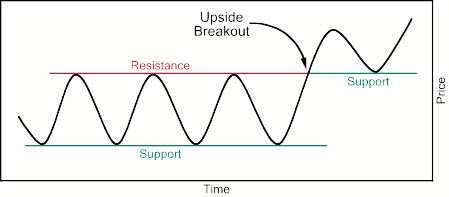
Charts displaying historical market data is an essential part of technical analysis. A trader relying on technical analysis isn’t interested in trying to determine any intrinsic company value. Instead, he or she uses historical trading data in an effort to predict the future. Displaying the data in the form of charts instead of just looking at raw data makes it easier to visualise what’s been going on and spot interesting patterns.
While the financial statements utilized in technical analysis tend to be the kind of statements that are released quarterly and yearly, the data utilized in technical analysis is updated continuously and you can use data from earlier this morning to make trading decisions for the afternoon.
Technical analysis has been heavily criticised by proponents of the efficient market hypothesis (EMH). According to this hypothesis, the market price is always the correct price. Any trading information from the past has therefore already been factored into the current price and trying to use historical data to detect undervalued securities is therefore pointless.
Proponents of strong or semi-strong EMH will typically also criticise fundamental analysis, as it is seen to be of little use for traders since all information in the market is already accounted for in the price of a share.
This article was last updated on: April 19, 2018