
As a novice technical analyst, it is easy to become so focused on price movements that we forget to take volume into account.
When we look at the price movements of a specific share, volume is the number of shares traded over a given period of time, e.g. during one trading day. The larger the volume, the more actively is the share traded. Fluctuations in volume can be displayed on its own chart, making it possible for you to notice interesting changes and patterns in trading volume. For this purpose, charts composed of volume bars are popular among technical analysts.
Why should I care about volume?
In technical analysis, volume is chiefly used to confirm trends and chart patterns. A price movement is seen as stronger and more relevant if the volume is big. When you notice a major price movement on a chart, it is a good idea to check out the volume too and see what it has to tell you.
Example: The share you are looking at has been in a downtrend for quite a while. Suddenly, there is a trading session where the price take a significant leap upwards. What gives? Is this just some strange anomaly that you should ignore, or is it an important signal that heralds a trend reversal? Take a look at the volume – hopefully it can provide you with important clues.
High volume: If the volume was high (relative to the average daily volume for the share), that should strengthen your suspicion that a reversal might be here.
Low volume: If the volume was low (relative to the average daily volume for the share), that should strengthen your suspicion that this is actually not the sign of a reversal.
As always, it is a good idea to try to obtain more information to see if other indicators are supporting or discouraging the idea of a reversal.
Volume moving with trend – or not
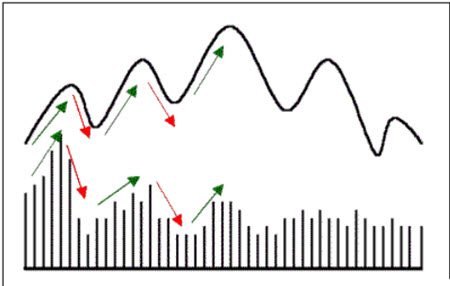
In general, volume will move with the trend. So if prices are moving upwards in an upward trend, you can expect to see volume increasing. If this relationship show signs of deteriorating, it is often a sign of a weakness in the trend. When volume trend and price trend at first glance seem to be telling two different stories, it is called divergence.
Example: The share has been in an uptrend for a while. Now, you notice that the volume is standing still or even going down on trading days compared to before, even though the price is still increasing. You have now been warned – the trend is likely on its last legs.
Using volume to confirm chart patterns
Chart patterns – such as triangles, flags and head & shoulders – can provide a technical analyst with important information. If these patterns are backed up by volume, they become considerably more trustworthy. Conversely, it can be risky to rely on a chart pattern that isn’t backed by volume.
Volume can give you advance warning
In many cases, changes in volume will come before significant changes in price. By carefully studying volume, the technical analyst can therefore frequently obtain fair warning about major price movements that are yet to come.
Example: We are in an uptrend for price, and everything is looking great. The price trend seems to be strong – the price is going up up up. Suddenly we notice a steady drop in volume. What is going on? The drop in volume is a warning. We should be extra vigilant – it is likely that the upward price trend is about to end.
This article was last updated on: February 28, 2017