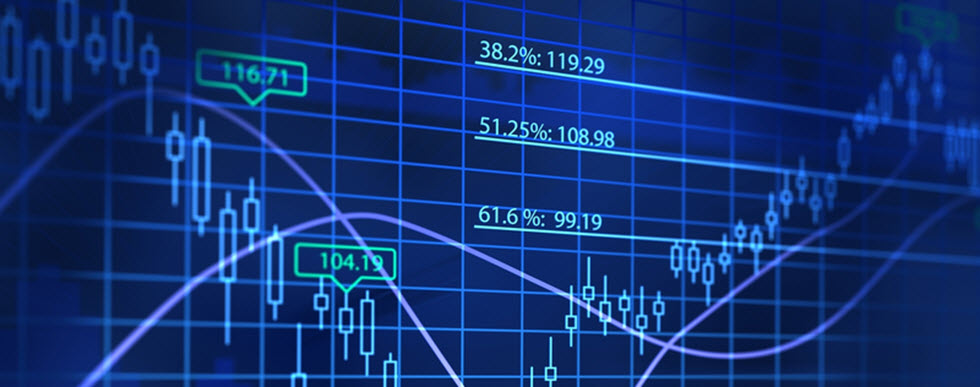
| Technical analysis | A method for predicting future market movements by analysing historical market data, typically utilizing charts. |
| Trendline | A line added to a chart to represent the trend in a market or in a stock. |
| Channel | Two parallel trendlines, one for the support level and one for the resistance level, will form a channel on the chart. |
| CFD | Certificate for difference. A type of financial instruments that are very popular among day traders. They make it possible to earn a lot of money from small market movements. You can learn more about CFD:s and how they work here. |
| Support level | A price level below which the price rarely (or never) falls during the studied period of time. |
| Resistance level | A price level above which he price rarely (or never) rise during the studies period of time. |
| Volume | The number of shares traded during the studies period of time. |
| Time scale | In technical analysis, you will find time scale information at the bottom of the chart. It will tell you about the time range for the chart, e.g. one trading day or one trading week comprised of five trading days.
Examples of commonly used time scales in technical analysis are intraday, daily, weekly, monthly, quarterly and annually. |
| Price scale | In technical analysis, you will find the price scale on the right-hand side of a chart that contains price information. The price scale can be linear or logarithmic. |
| Chart types | The four most commonly used chart types in technical analysis are the line chart, the bar chart, the candlestick chart and point & the figure chart. |
| Chart pattern | Technical analysts believe that certain patterns on a chart predicts events that are very likely to occur in the future.
Especially important are the patterns that predict either a continuation of the current trend or a reversal of the current trend. Examples of commonly used patterns:
|
| Indicators | In technical analysis, indicators are calculations based on historical price and historical volume. Indicators are often used to create buy or sell signals. Indicators can measure trends, volatility, momentum, money flow, etc.
Examples of common indicators: Accumulation / distribution line Average directional index (ADX) Relative strength index (RSI) On-balance volume (OBV) Aroon indicator |
| Leading indicator | An indicator that precedes price movements. |
| Lagging indicator | An indicator that folltiows price movements. |
This article was last updated on: June 20, 2017