In essence, technical analysis is the study of past supply and demand in the market. Today, a lot of software programs with advanced tools are available if you wish to learn technical analysis and incorporate it into your trading style, but it wasn’t always like that – technical analysis is possible without all the modern help. It can be just you with a bunch of raw data, doing charts manually.
Assumptions
The field of technical analysis is based on three assumptions:
- The market discounts everything
- Price moves in trends
- History tends to repeat itself
In the field of technical analysis, we assume that at any given time, a company’s fundamentals – and all other factors, such as broader economic factors and market psychology – are priced into the stock. This is what we mean when we say that the market discounts everything. The price is the result of supply and demand.
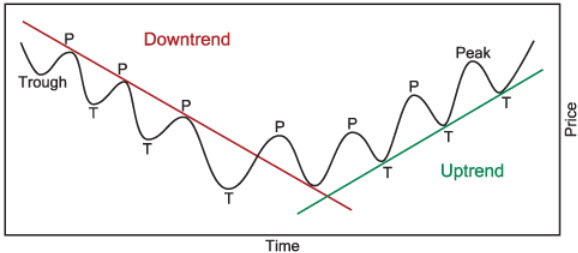
Trends are an essential aspect in technical analysis, as price is assumed to be moving in trends. A technical analyst will therefore spend a lot of time trying to identify uptrends, downtrends and sideways trends, and search for clues about the future of the trend – will continue or is it about to change? Technical analysis deals with both short-term, intermediate and long-term trends.
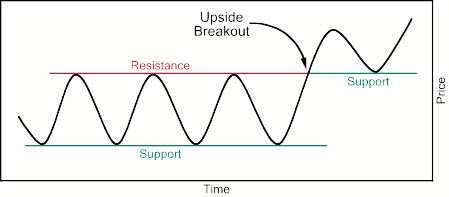
The technical analyst also believes that history has a tendency to repeat itself. That is why technical analysts are so interested in chart patterns. They identify certain patterns formed by historical data and use them in an effort to predict how the market will move once a certain pattern has been completed.
Is technical analysis for stock trading only?
No, technical analysis can be utilized for trading in vast selection of products, e.g. derivatives, commodities, fixed-income securities, and foreign currency.
On this page, we will often talk about technical analysis within the realm of stock trading, but most of the information provided is applicable to other types of trading as well.
This article was last updated on: February 28, 2017