
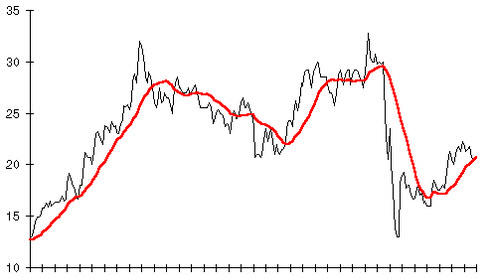
Moving averages is a good tool when you want to get an idea of a securities overall trend. A moving average is the average price of a security over a set amount of time. When you make a chart using the average price only, you don’t have to be dazzled by all the tiny price fluctuations up and down.
Within the field of technical analysis, moving averages – in their various incarnations – are utilized for a wide range of tasks. They can for instance come in handy when one wishes to identify current trends, outline support and resistance levels, and spot potential trend reversals.
Is he short-term average higher than the longer-term average? This indicates an uptrend.
Is the short-term average lower than the longer-term average? This indicates a downtrend.
Is the price moving through a major moving average? Take heed, because the trend is likely to reverse soon. Example: The price of a share in company XYZ has been in an uptrend for a while. You notice that the price of the share is now breaking through its 200-day moving average and falling below it. This is a signal: the uptrend is reversing.
Trend reversals
Moving averages can help you spot trend reversals.
Example: The price of a share has been in an uptrend for a while. Now, you notice that it is moving through the 50-period moving average and falling below it. This is a warning – the uptrend is likely to be reversing.
Be vigilant when the price moves through an important moving average, or moves through moving average crossovers. In the second case, one moving average is crossing through another. Example: The 15-day moving average crosses the path of the 50-day moving average and comes out above the 50-day moving average. This occurrence signals that a price increase period is likely to start soon.
- Are the periods used in the calculations short, e.g. 15-days and 35-days? If you spot a probable reversal, it is likely to be a short-term trend reversal.
- Are the periods used in the calculations longer, e.g. 50-days and 200-days? If you spot a probable reversal, it is likely to be a longer-term trend shift.
Time frames
You can use any time frame you want when you calculate moving averages. The most commonly utilized time frames among technical analysts are 10-days, 20-days, 50-days, 100-days and 200-days.
The 200-day average is typically utilized by the analyst who wants to get a good overview of a whole trading year for exchange listed securities. There are 365 (or 366) days in a year, but not all of them will be trading days.
The 100-day average is commonly regarded as a good measure of half a trading year. The 50-day average will consequently be used to represent a quarter of a year, the 20-day average a month and the 10-day average two weeks.
Types of moving averages
There are several different methods that can be used to calculate a moving average, and which method you pick will impact the result you get. It is therefore a good idea to learn about different methods and when to use them. Knowing about them will also decrease the risk of accidentally comparing two different moving averages without realizing that they have been calculated differently and thus shouldn’t be compared as if they had been calculated using the same method.
Below, we till take a look at three different methods that differ from each other when it comes to the weighting that they place on the price data; from equal weighting of each price to more weight being placed on more recent data. The three methods are the simple method, the linear method and the exponential method.
Calculating a Simple Moving Average (SMA)
This is a very easy method.
- Add all the past closing prices together for the time period.
- Divide the result by the number of prices entered into the calculation.
- The result is your moving average.
Example: You calculate the simple moving average for five trading days. The closing prices have been:
- Day 1: $5
- Day 2: $7
- Day 3: $5
- Day 4: $4
- Day 5: $6
- $5 + $7 + $5 + $4 + $6 = $27
- $27 / 5 entries = $5,40
- The moving average is $5,40.
Each point in the data series have the same impact on the end result as any other point in the data series. This means that the price for Day 1 has the same impact as the price for the more recent Day 5.
Calculating a Linear Weighted Average
This method was invented to give more recent data entries more weight than older data entries. Proponents of this method argue that more recent data is more important than older data. Therefore, more recent data should be given a greater impact on the end result of the calculation.
You calculate the linear weighted average like this:
- Multiply each closing price for the time period with its position in the data series.
- Divide the result by the sum of the multipliers.
- The result is your moving average.
Example: You calculate the moving average for five trading days. The closing prices have been:
- Day 1: $5
- Day 2: $7
- Day 3: $5
- Day 4: $4
- Day 5: $6
- $5 x 1 = $5
- $7 x 2 = $14
- $5 x 3 = $15
- $4 x 4 = $16
- $6 x 5 = $30
- $5 + $14 + $15 + $16 + $30 = $80
- Multiplier: 1 + 2 +3 + 4 + 5 = 15
- $80 / 15 multipliers = $5,33
- The moving average is $5,33.
The more recent a price point is, the larger the multiplier.
Calculating an Exponential Moving Average (EMA)
This method is more popular than the linear weighted average method, since it uses a smoothing factor that makes it more responsive to new information. If you use any technical analysis software, you can expect it to make this calculation for you. It is a bit complex, but yields a highly useful result.
This article was last updated on: February 28, 2017