
Spotting and interpreting trends is an essential part of technical analysis. Some trends are very straight forward and easy to spot and understand, while others are more complicated and might even go against the current of other trends for the same security, commodity, etc.
By correctly understanding trends, you can use them to decide when to get in and out of positions. Being able to identify trends also makes it possible to earn a lot of money trading 60 Second Binary Options.
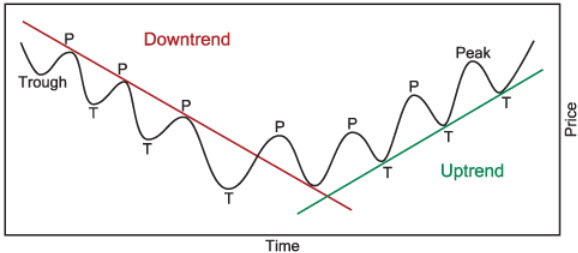
Uptrends & Downtrends
If we take a look at the price chart for a security, we will most likely see a line that is moving up and down in a series of highs and lows. We will not be gifted with a smooth line that is easy to interpret. Therefore, we must try to interpret where the overall trend is going, rather than getting obsessed with minute variations.
In technical analysis, an uptrend is a series of higher highs and higher lows. It is easy to get carried away when we see a series of higher highs, but it is not considered a true uptrend unless it is actually accompanies by higher lows.
Conversely, a downtrend is series of lower highs and lower lows.
Horizontal trends
If the peaks and dips show little variation, we are looking at a horizontal trend – also known as a sideways trend. A horizontal trend doesn’t fulfil the requirements for an uptrend, nor for a downtrend.
Short-term, intermediate or long-term?
When analysing trends, it is extremely important to know what you’re dealing with: it is a short-term trend, an intermediate trend or a long-term trend? This knowledge can impact how we interpret what we see in the charts, and it should definitely impact our decisions when it comes to opening and closing positions. You might for instance spot the start of a short-term downtrend, while at the same time still seeing an intermediate and a long-term uptrend, so you elect to keep your position open rather than panic and sell just because you spotted a short-term price decrease.
To be considered intermediate, a trend should be at least one month – but not long enough to become a long-term trend. In the stock market, there is often plenty of intermediate trends within the 1 month – 3 month span.
When looking at charts to spot and analyse trends, it is important to pick charts that best reflect the type of trend you are looking for – without simultaneously deluding yourself into picking charts based on their likelihood of displaying the trend that you want to see.
If you are trying to notice long-term trends, you might need to look at charts spanning 5+ years to get a proper overview. If you are trying to spot short-term trends, daily charts will be more useful. For intermediate trends, switching back and forth between daily charts and longer charts might be necessary to get the full picture.
What’s a trendline?
If you add a line to chart to represent a trend, that is a trendline. Having trendlines added to a chart will, among other things, make it easier to spot trend reversals.
Support & Resistance
Identify an upward trend. Draw a trendline connecting the lows of the upward trend. This will represent the support. This trendline helps technical analysts predict the point at which the price will start moving upwards again after a short-term dip within the upwards trend.
Identify a downward trend. Draw a trendline connecting the high peaks of the downward trend. This trendline will represent the resistance level. It will help technical analysts predict the resistance level of the price as the price moves upwards within the downwards trend.
What is a channel?
Add two parallel trendlines on your chart that denotes strong areas of support and resistance, respectively. The upper trendline connects the price peaks, while the lower trendline connects the lows.
The area between these two lines is known as the channel, and the lines are therefore called channel lines.
Depending on the trend, a channel will slope upwards or downwards, or just continue sideways. It is difficult for the price to fall below the support line or rise above the resistance line. For a period of time, you can expect a lot of trading to take place within the lines – until a break takes place. As lon as no break takes place, technical analysts will expect the trend to continue according to the established slope (or lack of slope).
As soon as a break has occurred, technical analysts will expect a sharp move in the direction of the break.
This article was last updated on: March 27, 2017