Swing trading forex sits in the middle ground between day trading and position trading. You are usually holding trades for a few days to a few weeks, which means your analysis has to handle two things at once: short term price movement and the broader market context. That is where many traders mess it up. They use tools built for scalping, apply them on the wrong timeframe, then blame the market when the trade gets chopped to bits.
The point of analytical tools in swing trading is not to predict every candle. It is to improve decision quality. A good tool helps you answer one of these questions: what is the trend, where is price likely to react, how strong is momentum, how much risk am I taking, and what could invalidate the setup.
If a tool does not help with one of those questions, it is probably decoration.

What swing traders actually need from analysis
Swing traders in forex need tools that reduce noise without making them slow. You are not trying to catch every intraday wiggle, but you also cannot ignore timing, because entries still matter. A strong macro view with a terrible entry can still bleed for days before the move starts, and most retail traders close before the thesis plays out.
This is why the best swing trading toolkit is usually a mix of price based tools, trend and momentum filters, volatility tools, and a basic macro calendar. Pure indicator stacking looks smart on a chart and feels scientific, but in practice it often gives you three versions of the same signal with a different color.
If you want to understand swing trading even better then I recommend you visit SwingTrading.com and read some of their swing trading guides. This will give you a good basic knowledge about swing trading.
Price action and market structure tools
Price action is not a separate religion. It is the base layer. Before touching indicators, a swing trader should map market structure on the daily and 4 hour charts. This means identifying trend direction, major swing highs and lows, range boundaries, and areas where price changed behavior before.
Support and resistance zones are still useful in forex because currencies often react around prior institutional activity. The mistake is drawing thin lines as if the market owes you precision. Treat them as zones. A pair like EURUSD may respect an area over several candles, not a single pip perfect level. If your process demands exactness, the market will teach you humility very fast.
Trendlines and channels can help, but only when they reflect repeated market behavior. Forced trendlines are one of the easiest ways to lie to yourself. If you need to rotate the chart, squint, and pray, the line is not real.
Market structure tools become stronger when you use multi timeframe analysis. For swing trading, the weekly chart helps with directional bias, the daily chart helps with setup context, and the 4 hour chart often gives better entry timing. You do not need seven timeframes. That is not analysis, that is panic.
Moving averages and trend filters
Moving averages are among the most useful tools for swing traders because they smooth price and make trend direction easier to read. They are lagging, yes. That is the point. A swing trader usually benefits more from catching the middle of a move with less stress than from trying to nail the first candle of a reversal and getting run over.
The 20 period, 50 period, and 200 period moving averages are common for a reason. They help frame short, medium, and long term direction. A daily chart with price above the 50 and 200 day average and a rising 20 day average gives a very different environment from a chart where price is below all three and the averages are flattening.
Exponential moving averages react faster than simple moving averages and are often preferred for timing pullbacks in trending markets. Simple moving averages can be cleaner for broader directional bias. There is no magic here. Pick one approach and use it consistently so your chart reading becomes automatic.
Crossovers can be used, but they are weaker as standalone entries for swing trading. They work better as filters. For example, you may decide to only take long setups when price is above the 200 day moving average and the 50 day average is not falling. That cuts out a lot of low quality countertrend trades without needing a complicated model.
Momentum oscillators that actually help
Momentum matters in swing trading because trends do not move at a constant speed. They expand, stall, and reverse. Oscillators can help you track that shift, but they are often misused.
The Relative Strength Index is useful when you stop treating it as a buy below 30 and sell above 70 button. In trending forex markets, RSI can stay overbought or oversold for longer than most new traders expect. That does not mean the indicator is broken. It means trend strength is high. For swing trading, RSI is often better for spotting momentum divergence, trend confirmation, and pullback conditions within a larger trend.
MACD is another good momentum tool for swing traders because it shows momentum direction and trend alignment in one view. The histogram can help you see momentum weakening before a crossover happens, which is useful for managing trades or avoiding late entries. MACD gets messy in choppy ranges, though, so it should not be trusted blindly when market structure is flat.
Stochastic oscillators can work in range trading conditions, especially when a pair is rotating between clear support and resistance zones. In strong trends, stochastic readings can stay extreme and create repeated false reversal signals. That is not a bug, it is the wrong tool for the job. Use it when the market is ranging, not when the pair is trending hard after a central bank shock.
The bigger point is this: use one momentum oscillator, not three. RSI plus MACD plus stochastic often gives you a false sense of confirmation because they all react to price in related ways.
Volatility tools for position sizing and trade management
Volatility is where swing traders either become disciplined or donate money to the market. A setup can be directionally correct and still fail because the stop is too tight for the pair’s normal daily movement.
Average True Range is one of the most practical tools in forex swing trading. ATR does not tell you direction. It tells you how much the market is moving. That is gold for setting stops, targets, and position size. If GBPJPY is printing a much higher ATR than EURCHF, using the same stop distance on both pairs makes no sense.
A common approach is to place stops at a multiple of ATR beyond a structure level, not directly on it. This helps avoid being clipped by normal volatility. For swing trades, many traders use something like 1.5x to 2.5x ATR depending on the pair and setup quality, then size the position so the monetary risk stays constant. That part matters. ATR without position sizing is only half the job.
Bollinger Bands can also help, especially for identifying volatility contraction and expansion. In ranges, price reacting around the outer bands can support mean reversion setups. In trends, repeated closes outside the band can signal strength, not reversal. Again, context first. The tool is fine. The interpretation is where people get cooked.
Fibonacci tools and retracement analysis
Fibonacci retracement is widely used in forex, and yes, it can become mystical nonsense if taken too far. Used properly, it is just a way to map pullback depth within a trend and align likely reaction zones with structure.
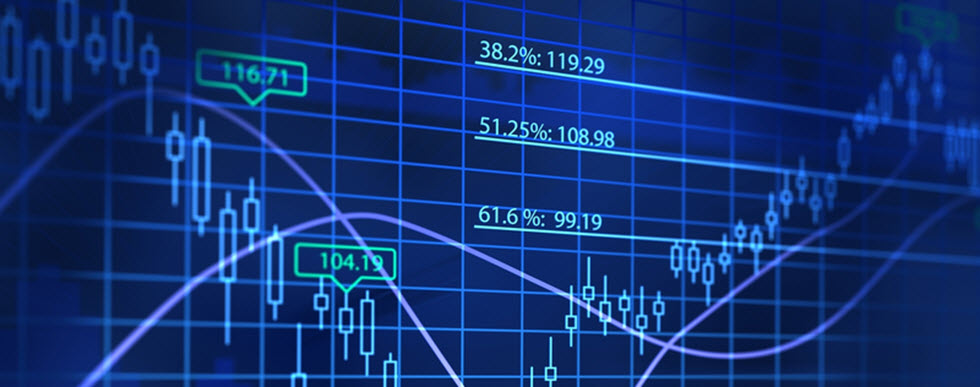
For swing trading, the most useful application is measuring a clean impulsive move and watching whether the pullback respects common retracement areas like 38.2 percent, 50 percent, or 61.8 percent near prior support or resistance. If a pullback reaches one of those zones and momentum starts to recover in the trend direction, you have a better structured setup than if you entered in the middle of nowhere because a candle looked nice.
Fibonacci extensions can also help with target planning. They are not guaranteed levels, but they help you avoid random profit targets. A trade plan that combines structure, ATR, and a measured extension tends to be more realistic than saying “I’ll just watch it.”
The trap is drawing Fibonacci on every tiny move. Only use it on clear, relevant swings that matter on your trading timeframe.
Candlestick analysis as a timing tool, not a strategy
Candlestick patterns are useful for swing traders, but mostly for timing around pre identified zones. A bullish engulfing candle in the middle of a random chart means very little. The same candle at a daily support zone, in an uptrend, after a measured pullback, with improving momentum, can be a solid trigger.
Pin bars, engulfing candles, inside bars, and rejection wicks are common timing signals. They work best when they confirm an idea you already had from market structure and trend analysis. If you are scanning for patterns first and context later, you are doing it backward.
Candles also help with trade management. A series of small candles after a strong move may suggest exhaustion or consolidation. A sharp rejection from a level can warn you to reduce exposure even if your stop is further away. This is the kind of practical reading that improves results without needing more indicators.
Volume proxies and sentiment tools in forex
Spot forex is decentralized, so true centralized volume is not available in the same way as futures or stocks. That said, traders still use volume proxies and sentiment tools.
Tick volume, available on many forex platforms, measures how often price changes rather than actual traded size. It is not perfect, but it can still be useful for identifying active periods and confirming breakouts. A breakout that occurs with rising tick activity often has better odds than one that drifts through a level on weak participation.
Retail sentiment data from brokers can also be useful, mostly as a contrarian context tool. If a very high percentage of retail traders are heavily positioned one way on a major pair, that can be a warning, not a signal by itself. Sentiment tools are strongest when they support other evidence, especially in stretched trends or around major technical levels.
For more advanced swing traders, currency futures data and COT reports can add a broader positioning view, particularly for majors like EURUSD, GBPUSD, and USDJPY. These are slower moving tools, better for directional bias than entries. They can stop you from fighting a larger positioning trend just because your 4 hour chart printed a cute reversal candle.
Fundamental and macro tools you should not ignore
A purely technical swing trading process in forex is possible, but it is weaker if you ignore macro drivers. Currencies are not just chart patterns. They move on rate expectations, inflation trends, growth surprises, and risk sentiment.
An economic calendar is a basic analytical tool, not admin work. Swing traders should track high impact events such as central bank decisions, CPI releases, employment data, and GDP prints for the currencies they trade. You do not need to predict every release, but you do need to know when volatility risk is likely to spike. Holding a leveraged swing position through a major central bank announcement without checking the calendar is not bold, it is lazy.
Interest rate differentials and central bank guidance are especially important for swing trading because they shape medium term currency trends. A pair can trend for weeks because the market is repricing the expected path of rates, even before the central bank actually moves. This is why reading central bank statements and watching policy tone matters more than memorizing candlestick names.
Bond yields, especially US Treasury yields for USD pairs, are also useful macro indicators. Rising or falling yields can shift dollar strength expectations and alter the behavior of major pairs. Correlations are not fixed, but they are worth monitoring.
Risk sentiment tools, such as equity index direction and volatility benchmarks, can also help with pairs tied to carry and risk appetite. For example, risk off conditions can affect JPY and CHF behavior in ways that pure chart analysis may not explain early enough.
Correlation and relative strength tools
Forex traders often treat each pair as separate, but many pairs are linked through the same currencies. Correlation analysis helps you avoid accidental overexposure. If you are long EURUSD, short USDCHF, and long GBPUSD, you may think you have three trades. In reality, you may just have one big anti USD position wearing different jackets.
A simple correlation matrix helps you see which pairs tend to move together over your holding period. Correlations change, so this is not a permanent rulebook. Still, checking recent correlation before loading multiple trades can prevent concentrated risk.
Relative strength analysis across currencies is even better for swing trading. Instead of only asking “does EURUSD look bullish,” ask which currencies are broadly strong and which are broadly weak. When you pair strong against weak, trends often travel further and cleaner. This can be done with currency strength dashboards, custom indices, or just manual comparison across major pairs if your process is disciplined.
This is where many swing traders improve fast. They stop forcing setups on one favorite pair and start selecting pairs where the strength imbalance is obvious.
Risk and performance analytics tools
Risk tools are analytical tools. They are just less exciting to look at, so people ignore them until the account starts wheezing.
Position sizing calculators are essential in swing trading because stop distances vary by setup and pair volatility. If your risk per trade is fixed as a percentage of capital, a calculator makes execution consistent. Without this, traders tend to oversize “high conviction” trades and undersize trades that actually fit their plan.
Risk to reward calculators are useful, but they should be grounded in realistic market structure. A beautiful 1 to 4 ratio is meaningless if the target sits beyond three major resistance zones and a central bank meeting. Dry planning beats motivational math.
Trade journaling tools are underrated. A proper journal tracks setup type, timeframe, entry reason, stop logic, target logic, news context, and post trade outcome. Over time, this shows what actually works in your process. Most traders say they are “price action traders” or “trend traders,” but when they review data, they learn they are actually profitable only in one condition and lose money in another. That is not a personality issue. It is a measurement issue.
Equity curve analysis also matters. If your strategy performs poorly during low volatility ranges, you can reduce size or frequency during those periods. That is a strategic use of analytics, not just recordkeeping.
Building a clean swing trading toolkit
A strong swing trading workflow does not need twenty indicators. A clean setup often looks like this: market structure on weekly and daily charts, one trend filter like moving averages, one momentum tool like RSI or MACD, one volatility tool like ATR, and an economic calendar for event risk. Add correlation awareness and proper risk sizing, and you have a serious framework.
The edge is not in finding a hidden indicator with a dramatic name. It is in using a small group of tools consistently, in the right order, with clear rules for what confirms a setup and what invalidates it.
Most bad trades are not caused by a lack of tools. They happen because the trader skipped context, ignored volatility, or forced a trade before the setup was ready. Same chart, same tools, same week, very different result.
Final thoughts
For forex swing trading, the best analytical tools are the ones that improve decision quality across trend, momentum, volatility, timing, and risk. Price structure and support resistance do the heavy lifting. Moving averages and momentum tools help filter and time. ATR keeps your risk honest. Macro calendars keep you out of avoidable chaos. Correlation and journaling stop you from repeating the same mistakes with more confidence.
This article was last updated on: March 5, 2026